


Weekly Market Commentary September 28, 2026
LPL Research explores how geopolitical tensions, higher interest rates, and AI investment are adding to the stock market’s wall of worry.

Last Edited by: LPL Research
Last Updated: September 28, 2026
Stock Market's Wall of Worry Gets Taller
Stocks continue to climb a wall of worry, a wall that has gotten a bit taller as fall begins. The conflict in the Middle East, higher interest rates, and questions surrounding the enormous artificial intelligence (AI) capital spending boom all present legitimate risks for investors. While each of these challenges could generate bouts of volatility, we believe the fundamental backdrop remains supportive enough for stocks to weather them. Here, we assess the market's growing wall of worry, explain why these worries warrant attention, and justify our continued constructive intermediate-to-long-term stock market outlook.
Middle East Conflict and Surging Oil
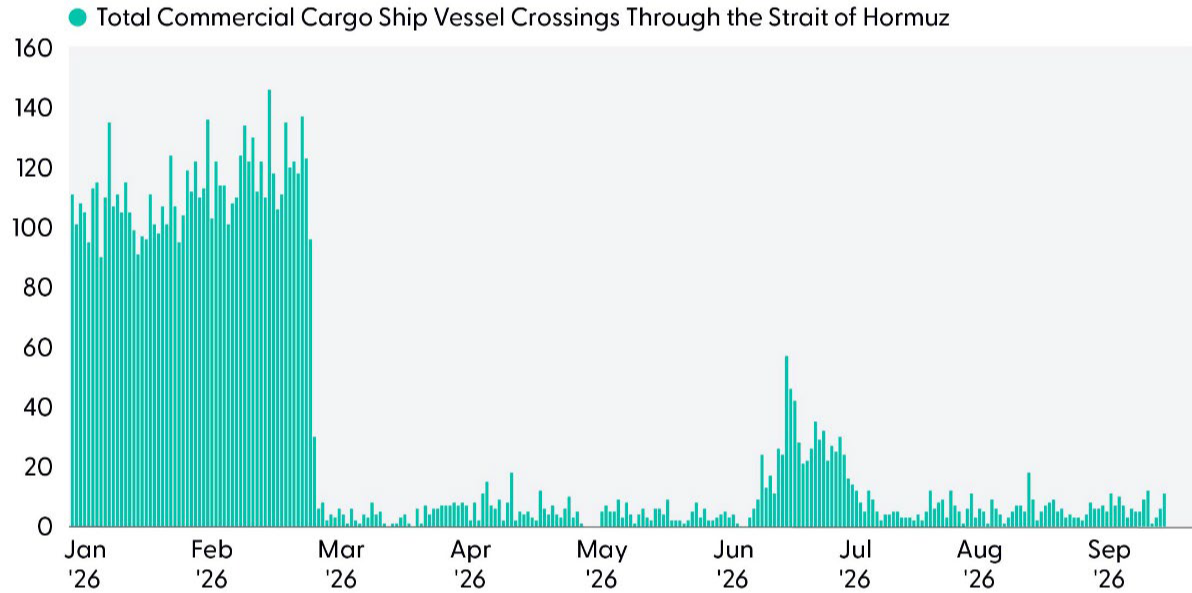
The latest developments in the Iran conflict have shaken the fragile consensus view that disruptions to the Strait of Hormuz and the Red Sea would soon be cleared. U.S. military bases and naval escorts in the region have been fired upon. The critical East-West pipeline in Saudi Arabia that had been providing a partial bypass for the bottlenecked Strait of Hormuz is not yet fully operational and faces continued attacks. Energy stockpiles are dwindling in the U.S. and around the globe. Despite reports coming out of last week's UN summit that the U.S. and Iran are exploring a deal to open Hormuz (which President Trump rejected over the weekend), WTI crude remains very elevated at $93 per barrel (as of September 25).
Predicting the path of this conflict is extremely difficult, as the back-and-forth continues. As asset allocators, we prefer to maintain our energy sector overweight and positive view of the broader commodities complex while waiting for a lasting fix to restricted tanker traffic in the Strait of Hormuz and, to a lesser extent, the Bab el-Mandeb Strait. We will believe it when we see it, but recent headlines have provided some encouragement for a diplomatic resolution. Ongoing pressure from China, Gulf allies, sanctions, and voters' affordability concerns ahead of the midterms may help provide the final push needed to bring the conflict to a resolution soon.
Tanker Traffic Through the Strait of Hormuz Remains Depressed
Source: LPL Research, Bloomberg 09/24/26
Rising Interest Rates and Fed Rate Hikes
Related to the worry about oil, rising interest rates are perhaps the biggest piece of the wall of worry right now, with the 10-year Treasury yield reaching 5.2% last week, the highest level since 2007, when the yield topped out at 5.30%. Rising interest rates present a near-term risk for stocks by increasing borrowing costs while presenting a headwind for stock market valuations.
History suggests higher interest rates and anticipation of rate hikes by the Federal Reserve create stock market volatility, but drawdowns have typically been short-lived. As we wrote in our September 9 market article, across the six Fed tightening cycles since 1994, the S&P 500 generally struggled during the first several months after the initial rate hike before subsequently regaining its footing and moving higher. Gains in the 12 months following the initial hike during the non-recessionary cycles (for this exercise, we'll allow 2022 to count as recessionary even though it technically was not) averaged 14.3%, with a median of 7.2%.
While the prospect of tighter monetary policy is certainly a risk to markets, particularly with the S&P 500 near record highs, we expect the current economic backdrop and related strength in earnings to provide enough support for stocks to minimize the magnitude of near-term volatility.
In terms of longer-term rates, which directly affect borrowing costs for consumers and businesses, LPL's Chief Economist Dr. Jeffrey Roach explained in our September 14 Weekly Market Commentary why the U.S. economy today is more resilient to rising rates than in the past. Reasons include the powerful wealth effect from the bull market in stocks and the plethora of fixed-rate mortgages at low interest rates.
Long-term interest rates also affect stock valuations, though not as much as you might think. As shown in the scatterplot chart, “Stock Valuations Have Held Up Relatively Well Historically at 5-6% Yields,” a 5% yield on the U.S. 10-year Treasury does not necessarily spell doom for this market. Although many of these observations came during the late-1990s dot-com boom, when the U.S. had a far more manageable debt load, it is noteworthy that the 10-year yield averaged 5.9% and the S&P 500 price-to-earnings ratio (P/E) averaged 23 during that period. Strong earnings and revolutionary technology development are a common theme between the two time periods.
Stock Valuations Have Held Up Relatively Well Historically at 5-6% Yields
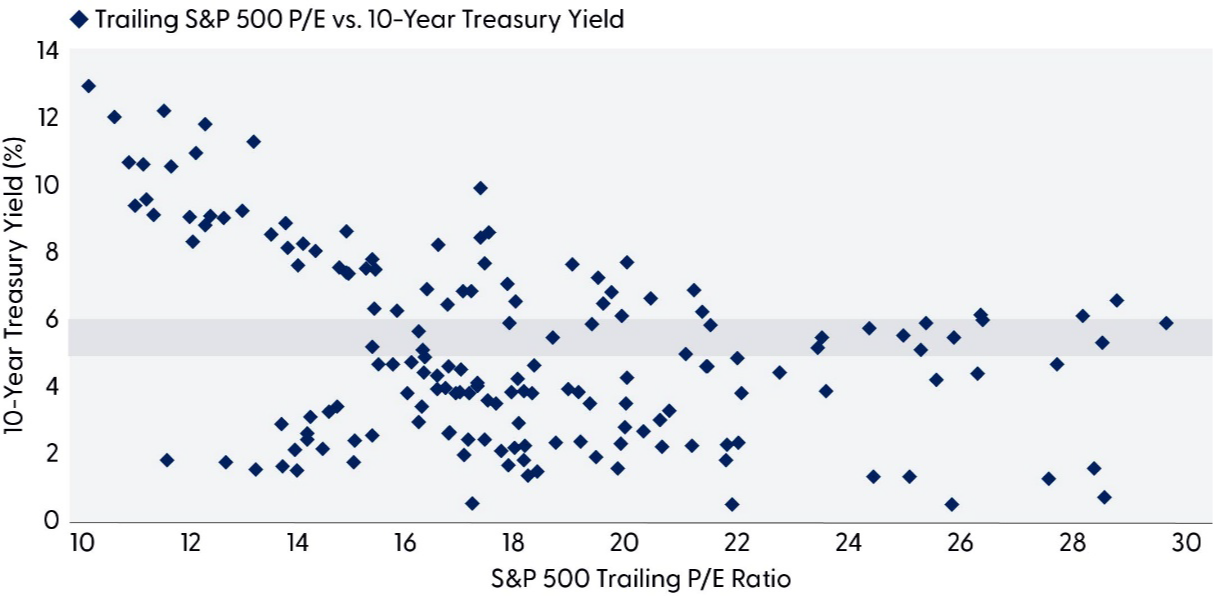
Source: LPL Research, Bloomberg 09/22/26 (Data 1980 to present; darker shaded area represents 10-year Treasury yields of 5-6%)
Disclosures: All indexes are unmanaged and cannot be invested in directly. Past performance is no guarantee of future results.
Artificial Intelligence Leads to a Rerun of the Bursting of the Dotcom Bubble Burst
As we wrote in our Midyear Outlook 2026: Policy, Buildouts, & Bottlenecks, artificial intelligence (AI) has entered a more advanced phase where the buildout winners may cede leadership to those that can monetize the technology. If the next leg of Al adoption delivers as expected, the Al leaders in the U.S. and emerging Asia will be winners. If not, the hyperscalers making these massive investments may struggle as the investment cycle matures and comes under more scrutiny. Our expectation that scrutiny on Al investments would intensify in the second half of this year was a key reason why our year-end fair value estimate for the S&P 500, at a range of 7,650-7,750, is on the conservative side.
Given the theme of this commentary is worries, we'll start with the bad news. The nearly $1 trillion in hyperscaler capital investment this year, and more than $1 trillion anticipated over at least the next two years, a healthy chunk of which will be debt-financed, has likely wiped out 2027 free cash flow for this group of five U.S. technology leaders, illustrated in the “Hyperscaler Free Cash Flow May Have Been Erased Until $2028” chart. Current consensus estimates call for a return to positive free cash flow for this group in two years, but even in 2028, free cash flow is expected to be only about one-third of what it averaged during the past three years before the spending boom exploded higher.
Hyperscaler Free Cash Flow May Have Been Erased Until 2028

Source: LPL Research, Bloomberg 09/22/26
Disclosures: All indexes are unmanaged and cannot be invested in directly. Past performance is no guarantee of future results. Estimates may not materialize as predicted and are subject to change.
Hyperscalers represented include Alphabet (GOOG/L), Amazon (AMZN), Microsoft (MSFT), Meta (META), and Oracle (ORCL).
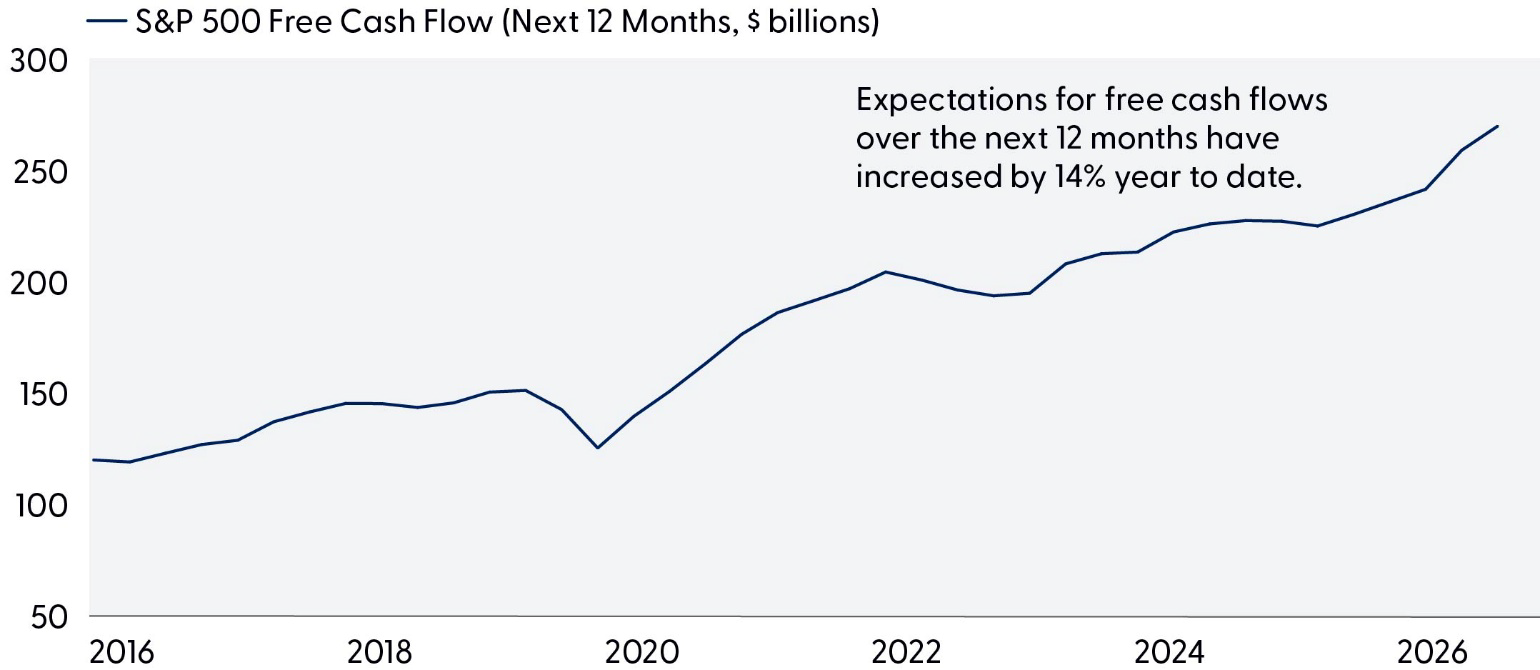
But here's the good news. The capital expenditures for the hyperscalers are cash flows for the chipmakers, memory producers, and other Al infrastructure vendors. So, while free cash flows are depressed for one segment of the market, i.e., hyperscalers, it's getting a boost from another segment. Put those together and you get a solid outlook for free cash flows for the broad market. Keep in mind these are just estimates and corporate America could fall short of these numbers. But, as noted in the “Free Cash Flow Outlook for Broad Market Looks Just Fine” chart, enough offsets are expected to be in place to offset depressed free cash flows from the hyperscalers.
We freely admit there may be some overly optimistic assumptions about productivity gains, margin expansion, or even Al model pricing embedded in these forecasts. But, even if that is the case, it would take a lot of wasteful Al investment and probably a stalled economy (unlikely in our view) to prevent free cash flow at the broad market level from increasing over the next couple of years.
Free Cash Flow Outlook for Broad Market Looks Just Fine
Source: LPL Research, Bloomberg, 09/22/26
Indexes are unmanaged and cannot be invested in directly. Past performance is no guarantee of future results. Estimates may not materialize as predicted and are subject to change.
Bottom line, the uncertainty around payoffs from Al is a risk for markets, but we believe it's a manageable risk. Returns from Al need to justify capital outlays no small task but the weight of the evidence tells us not to bet against hyperscalers or equity markets broadly. Some spending will likely end up being ill-advised, but the companies doing the spending are in much better financial condition than those building out the internet nearly 30 years ago. This stock market may not have as much near-term upside as this Al debate continues during a seasonally challenging period leading up to the midterm elections. However, we expect stocks to continue to be well supported even in the face of Middle East turmoil and potential further increases in interest rates.
Conclusion
Investors have plenty to worry about as fall begins. The conflict in the Middle East continues to disrupt critical energy infrastructure and transportation routes, keeping oil prices elevated and adding uncertainty around inflation. Meanwhile, rising interest rates and the prospect of additional rate hikes from the Fed could contribute to near-term market volatility. The enormous capital being committed to Al raises questions about the returns on that investment.
All in all, we believe these risks are manageable. The economy has demonstrated resilience in the face of these headwinds. Corporate earnings remain very strong. The stock market's track record during non-recessionary Fed tightening cycles is excellent, though past performance does not guarantee future results. Higher Treasury yields may constrain valuations, but strong earnings offer a powerful offset. While the Al investment boom inevitably will produce some winners and losers, the cash flow outlook for the broad market appears healthy. Finally, one of the strongest 12-month seasonal periods of the four-year presidential cycle for stocks is fast approaching, with midterm elections only five weeks away.
Bottom line, these crosscurrents may limit near-term upside, and create periodic volatility, but they do not undermine our constructive intermediate-to longer-term view of equities.
Asset Allocation Insights
LPL's Strategic and Tactical Asset Allocation Committee (STAAC) maintains its recommendation for a tactical equity overweight and fixed income underweight. We believe prospects for the macro backdrop to improve and the Al-driven earnings boom will continue to support the broad equity market through 2026. The Committee favors the quality factor to express the tactical equity overweight, while overweighting the industrials and energy sectors. Industrial companies offer a lower-beta way to benefit from the Al infrastructure buildout, while an energy overweight offers a desirable hedge against potential additional disruptions to global energy production and transportation.
On the fixed income side, we remain neutral relative to benchmark duration. In credit, we prefer to stay up in quality and resist the temptation to reach for spreads in a market where Al-related issuance is already filling the index with long, tight, single-name concentration. Securitized sectors (asset-backed securities and select collateralized mortgage-backed securities) remain attractive, while non-U.S. developed and emerging market debt increase income opportunities and offer diversification benefits.
Jeffrey Buchbinder, CFA, Chief Equity Strategist, LPL Financial
Important Disclosures
This material is for general information only and is not intended to provide specific advice or recommendations for any individual. There is no assurance that the views or strategies discussed are suitable for all investors or will yield positive outcomes. Investing involves risks including possible loss of principal. Any economic forecasts set forth may not develop as predicted and are subject to change.
References to markets, asset classes, and sectors are generally regarding the corresponding market index. Indexes are unmanaged statistical composites and cannot be invested into directly. Index performance is not indicative of the performance of any investment and do not reflect fees, expenses, or sales charges. All performance referenced is historical and is no guarantee of future results.
Any company names noted herein are for educational purposes only and not an indication of trading intent or a solicitation of their products or services. LPL Financial doesn't provide research on individual equities.
All information is believed to be from reliable sources; however, LPL Financial makes no representation as to its completeness or accuracy.
All investing involves risk, including possible loss of principal.
Important Scenario Analysis Disclosure: The analyses, scenarios, projections, and estimated returns discussed herein are hypothetical, are based on assumptions and estimates, and are provided solely for illustrative and educational purposes. The hypothetical "average hyperscaler" referenced in this report does not represent an actual company, portfolio, account, or investment product. Results shown are not forecasts or guarantees of future performance and are not intended to predict or project the performance of any specific security, company, sector, or market. Actual results may differ materially due to changes in economic conditions, competitive dynamics, technology adoption, capital spending, utilization rates, pricing, regulation, operating costs, and other factors.
The hypothetical results shown were not achieved by any actual investment strategy, account, or client and should not be viewed as indicative of actual investment results.
US Treasuries may be considered "safe haven" investments but do carry some degree of risk including interest rate, credit, and market risk.
Bonds are subject to market and interest rate risk if sold prior to maturity. Bond values will decline as interest rates rise and bonds are subject to availability and change in price.
The Standard & Poor's 500 Index (S&P500) is a capitalization-weighted index of 500 stocks designed to measure performance of the broad domestic economy through changes in the aggregate market value of 500 stocks representing all major industries.
The PE ratio (price-to-earnings ratio) is a measure of the price paid for a share relative to the annual net income or profit earned by the firm per share. It is a financial ratio used for valuation: a higher PE ratio means that investors are paying more for each unit of net income, so the stock is more expensive compared to one with lower PE ratio.
Earnings per share (EPS) is the portion of a company's profit allocated to each outstanding share of common stock. EPS serves as an indicator of a company's profitability. Earnings per share is generally considered to be the single most important variable in determining a share's price. It is also a major component used to calculate the price-to-earnings valuation ratio.
All index data from FactSet or Bloomberg.
This research material has been prepared by LPL Financial LLC.
Not Insured by FDIC/NCUA or Any Other Government Agency | Not Bank/Credit Union Guaranteed | Not Bank/Credit Union Deposits or Obligations | May Lose Value
RES-0007122-0526 Tracking #1181288 | #1181291 (Εxp. 09/27)